Our Labor Force
Explore data about the businesses in our region and the employees who keep them running.


What do you need help with today?
- Development Services
- Find Targeted Sites
- Active Projects & Permits
- Recent Relocations & Expansion
- Financing & Incentives
- Tax Information


Find your perfect buildingResearch available sites and buildings to find the right location for your needs.
Learn more
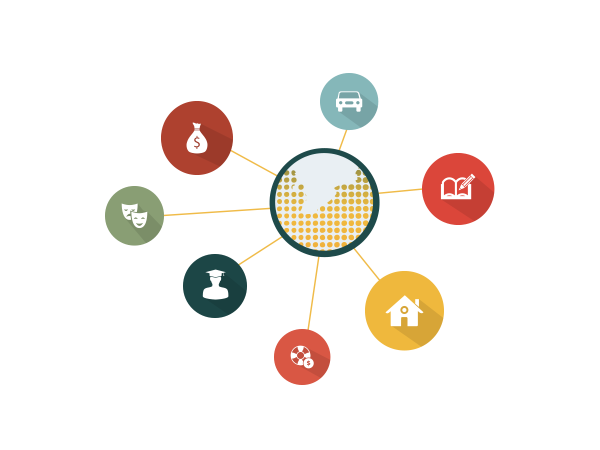
Explore our communityOur live, interactive infographic provides a snapshot overview of our community.
Learn more
Here are the stories behind our community

With the help of the Amarillo EDC, a successful business case was developed for constructing a new manufacturing facility in Amarillo.

We needed a facility in the center of the United States to be able to better serve our customers. The Panhandle region has provided greater access to more U.S. customers.

The solid foundation formed through the collaboration and support of the Amarillo EDC allows Golden Spread to focus on additional elements of our long term vision and meet our 2020 goals.